What a Local SEO Report Should Actually Show You
Published August 25, 2026
What a Local SEO Report Should Actually Show You

A local SEO report only earns its place on a client’s desk if it proves visibility changes in the map pack, ties those changes to Google Business Profile interactions, and connects both to real conversions like calls, direction requests, or bookings. The best reports track three headline metrics: visibility, GBP interactions, and conversions. Everything else, including templates and automation, exists to make those three numbers easy to read and impossible to ignore.
TL;DR:
- Local SEO reports should prioritize Google Business Profile interactions, rankings, and conversions over impressions or profile views alone.
- Including a GeoGrid heatmap and proximity-based ranking data provides vital insight into visibility variations across different locations.
- Automating data collection with tools like white-label dashboards and GeoGrid support ensures consistency and saves time, especially for multiple locations.
- Reports should begin with a clear headline KPI and plain-language attribution, followed by actionable next-step priorities to maintain client engagement.
- Timing the report before billing cycles and framing results within trend context greatly improve client retention and renewal chances.
Table of Contents
- What Local SEO Metrics Belong in Every Report
- How Do You Build a Local SEO Report Step by Step?
- Which Tools and Templates Work Best for Local SEO Reporting?
- How Do You Turn SEO Data Into a Report Clients Actually Read?
- Publisher Tools That Support Local SEO Reporting
- A Copy-Ready Local SEO Report Template
- Reporting Is the Retention Engine Agencies Underuse
- How Localseobot Makes Local SEO Reporting Easier
- Sources
What Local SEO Metrics Belong in Every Report
Most local SEO reports fail for one reason: they lead with metrics that feel impressive but don’t move a business decision. Impressions and profile views matter, but only when they’re framed against the actions that follow them.
Start with Google Business Profile interactions. GBP gives you a direct read on demand: how many people searched for the business, viewed the profile, clicked to call, requested directions, or visited the website. A spike in profile views with flat call volume tells a different story than the reverse, and a good report calls that gap out explicitly rather than burying it in a chart.
Rankings need more nuance than a single number. A single “average rank” figure hides the fact that local search results shift based on the searcher’s physical location, so two customers three miles apart can see completely different map packs. A GeoGrid, which plots ranking position across a grid of coordinates around the business, shows exactly where visibility is strong and where it drops off, which matters far more to an owner deciding where to advertise next.
Traffic and conversion tracking should separate branded traffic from discovery traffic, and call tracking should distinguish GBP-driven calls from website-driven calls whenever the phone system allows it. Review metrics round out the picture: review velocity, average rating trend, and response rate all signal reputation health, and a simple sentiment tag (positive, neutral, negative) on recent reviews gives context numbers alone can’t.
Key elements a complete metrics section covers:
- GBP interactions: calls, website clicks, direction requests, and profile views, each tracked month over month
- Rankings: GeoGrid heatmap plus proximity-based 3-pack visibility for priority keywords
- Traffic and conversions: organic sessions from local intent pages, form fills, and call volume
- Reviews and reputation: new review count, average rating, and response rate
- NAP and citation health: consistency across directories and any GBP suspensions or unverified fields
Reporting note: the metrics that matter most tend to be the ones tied to intent, not volume. Survey data shows 82 percent of smartphone shoppers run “near me” searches before visiting a business, which is exactly why direction requests and GBP clicks deserve more weight in a report than raw impression counts. For a fuller breakdown of these definitions, key metrics for local SEO success covers the formulas behind each one.
How Do You Build a Local SEO Report Step by Step?
A repeatable process is what separates a report that gets read from one that gets skimmed and forgotten. Follow this sequence every cycle so the format stays consistent even as the data changes.
- Define the goal and audience first. A franchise owner wants store-level performance; a marketing director wants portfolio trends. Map each KPI back to a business objective (more calls, more foot traffic, more bookings) before you touch a dashboard.
- Pull data from every relevant source. That typically means the GBP API or dashboard, Google Search Console, GA4, a dedicated rank tracker for GeoGrid data, review platforms, and call tracking software. Missing even one source creates blind spots, especially around attribution.
- Set the date range and baseline. Month over month works for most retainers; quarter over quarter suits slower-moving categories like legal or home services. Always annotate seasonality (holiday closures, local events, algorithm updates) so a dip doesn’t read as underperformance.
- Assemble the visuals. KPI tiles up top, a GeoGrid heatmap for rankings, trend lines for traffic and calls, and short annotated notes wherever a number needs context a chart can’t provide on its own.
- Run a quality check before sending. Confirm every link works, every number matches its source, and nothing pulled from a cached or stale connector.
Pro Tip: Build your baseline period into the template itself, not just the current month’s data. A client who sees “12 calls this month” has no context. A client who sees “12 calls, up from 7 three months ago” understands the trend instantly.
Skipping the annotation step is the single most common mistake in local rankings analysis. A ranking drop that coincides with a Google core update reads as a crisis without that context and as a normal fluctuation with it.

Which Tools and Templates Work Best for Local SEO Reporting?
Choosing the right tooling depends less on budget and more on how many locations you’re reporting on and whether the client wants a live dashboard or a delivered document.
Live dashboards built in Google Looker Studio (formerly Data Studio) work well for clients who want to check numbers between report cycles. Pre-built Looker Studio templates pull Search Console and GBP data automatically and cut setup time significantly, though connector reliability varies and sampling limits on some data sources can distort smaller accounts.
Scheduled white-label PDFs suit agencies managing dozens of client locations who need a consistent, branded document delivered on autopilot rather than a dashboard someone has to remember to check. Manual exports using free tools like Search Console, GA4, and GBP Insights can produce a workable report for a single location, but that stack lacks native GeoGrid visualization and requires manual assembly of every chart, which doesn’t scale past a handful of clients.
Tool categories worth knowing:
- Rank trackers with GeoGrid support: show ranking variance across a coverage area, not just one search result
- Automated white-label platforms: generate branded PDFs or live links on a schedule with no manual pull
- Looker Studio plus connectors: best for teams that already live in Google’s ecosystem and want customization
- Call tracking integrations: attribute phone conversions to specific campaigns or GBP listings
Whichever path you pick, the connector setup deserves attention before the first report goes out. Authentication scopes, data refresh cadence, and sampling thresholds all affect whether the numbers you present match what the client sees when they check GBP Insights themselves. A comparison of SEO tools for agencies is a useful reference point when weighing platform trade-offs, and Localseobot’s own SEO tool for agencies folds GeoGrid tracking and white-label export into one dashboard, which removes a lot of the connector guesswork for teams managing multiple locations.
How Do You Turn SEO Data Into a Report Clients Actually Read?
Numbers without a narrative get skimmed once and ignored. The report that gets forwarded to a CEO or discussed on a renewal call is the one that opens with the headline result, not a wall of charts.
Lead with the single most important number and what it means for the business, not the metric that happened to move the most. “Impressions increased” does not, even when the underlying percentage is larger.
Visuals should carry captions that do the interpreting for the reader. A GeoGrid heatmap with no caption is just colored dots; a GeoGrid heatmap captioned “Visibility improved in the 3-mile radius east of downtown, where a new competitor opened in March” tells the client exactly what happened and why.
Presentation habits that separate a report clients read from one they skim:
- Open with the headline KPI and one sentence of context, before any chart appears
- Use before/after snapshots for rankings and review counts rather than raw trend lines alone
- Write attribution in plain language: “The citation cleanup completed in week two likely contributed to the ranking gain in week four” rather than vague causality
- Close every report with a prioritized next-month plan, not just a summary of what already happened
Pro Tip: Frame the next-month plan as three ranked priorities, not ten. A client who sees ten action items assumes nothing is actually urgent. A client who sees three assumes you know exactly what matters.
Monthly delivery remains the standard cadence for most retainers, timed to land a few days before the billing cycle renews so the conversation starts with results rather than an invoice.
Publisher Tools That Support Local SEO Reporting
Localseobot’s toolset was built around the same three pillars that belong in any local SEO report: visibility, engagement, and conversion. The Local SEO Checker audits GBP health and flags the technical issues that quietly suppress visibility before they show up as a ranking drop. The Local Search Visibility Analyzer generates a visibility score and GeoGrid-style output that maps directly onto the rankings section of a report.

Localseobot backs its citation work with a 30-day money-back guarantee if a client’s rankings don’t improve, a policy that reflects confidence in manual citation building over automated placement.
Tools that map directly to report sections:
- Local SEO Checker: GBP health and citation consistency, feeding the NAP/citation section
- Local Search Visibility Analyzer: visibility scoring and GeoGrid-style output for the rankings section
- Automated GBP posting and review tools: source data for the engagement and reputation sections
- White-label agency dashboard: exports the finished report in a branded, client-ready format
Client-reported outcomes generally center on two things: improved Google Maps positioning and a measurable increase in customer calls, which lines up with the two metrics this guide treats as the real proof of local SEO performance.
A Copy-Ready Local SEO Report Template
Paste this structure into Looker Studio, a PDF template, or your agency’s white-label tool and adjust the KPIs to match the client’s goals.
- Executive summary (1 to 2 lines): headline KPI, direction of movement, and one sentence of context. Example: “GBP calls rose 18% this month, driven by improved visibility in the north service area.”
- KPI tiles: GBP calls (source: GBP Insights), website clicks (GBP Insights), direction requests (GBP Insights), organic sessions (GA4), average rank (rank tracker).
- GeoGrid snapshot: a heatmap image with a caption stating which zones improved or declined and a likely cause.
- GBP health checklist: profile completeness, category accuracy, photo freshness, and posting cadence, each marked pass or needs attention.
- Pre-send QA: verify every link opens, confirm no personal client data appears in a publicly shared link, and check the sender identity matches the agency’s branding.
| Report section | What it must include |
|---|---|
| Executive summary | Headline KPI and one line of context |
| KPI tiles | Calls, clicks, direction requests, rank, organic sessions |
| GeoGrid snapshot | Heatmap image with a plain-language caption |
| GBP health check | Profile completeness, categories, photos, posting cadence |
| Next-month plan | Three ranked priorities tied to measurable goals |
Reporting Is the Retention Engine Agencies Underuse
Most agencies treat reporting as a compliance task, something to check off before the invoice goes out. That’s backward. A report built around trend context and a clear next-month plan is what shifts a renewal conversation from “what did we pay for” to “what are we doing next,” and that shift is what actually reduces churn.
Time the report to land a few days before the billing cycle, never the same day. Clients need a moment to read results before they see a charge. Build the habit once with a solid template, and every future report becomes a five-minute update instead of a monthly scramble.
— Local
How Localseobot Makes Local SEO Reporting Easier
Localseobot is built for exactly the reporting workflow this guide describes: white-label PDFs, GeoGrid heatmaps, and visibility scores that pull straight into a client-ready format without hours of manual assembly. Instead of stitching together Search Console exports and a separate rank tracker, you get GBP interactions, ranking data, and review signals in one dashboard built specifically for local visibility.
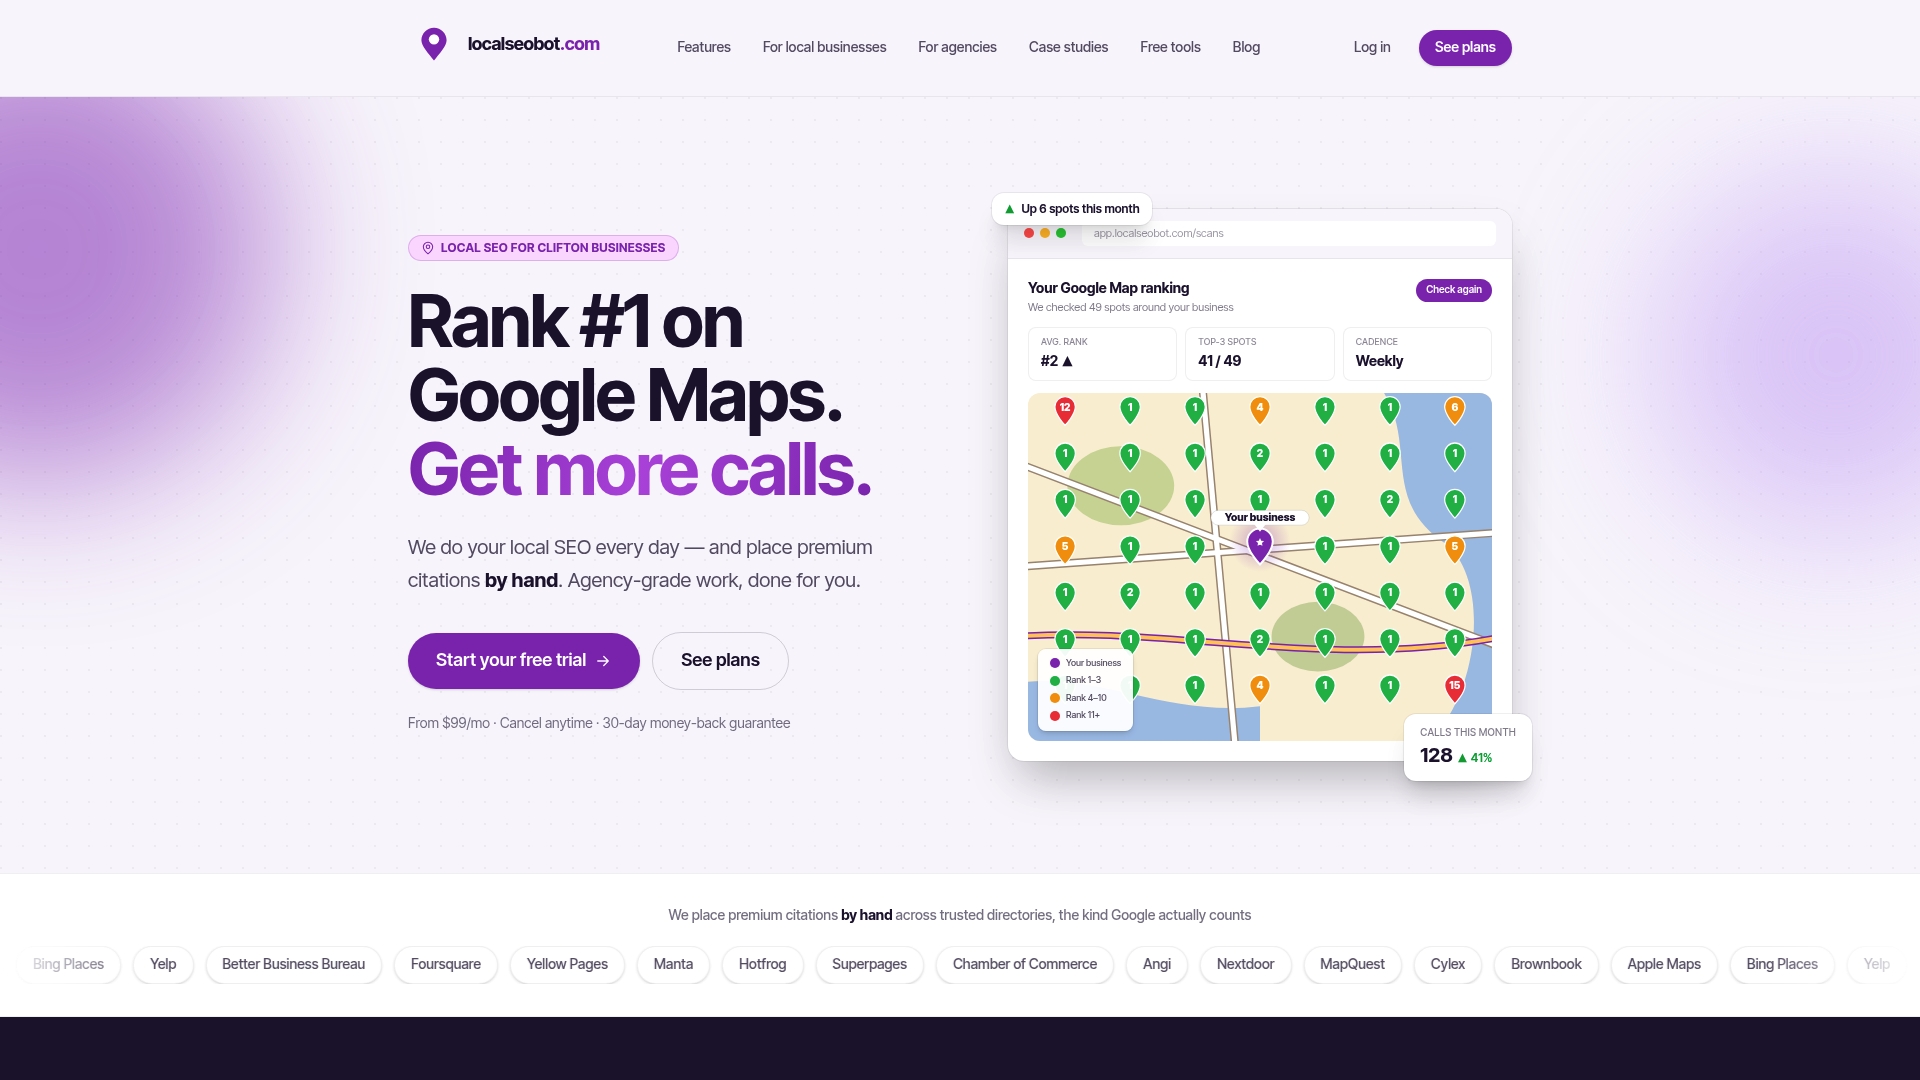
If you’re starting from scratch, run the Local SEO Checker first to see where a profile’s GBP health stands, then use the Local Search Visibility Analyzer to generate a visibility score you can drop straight into a KPI tile. Agencies managing multiple locations can explore the white-label dashboard on the agency tool page to see how automated report delivery fits into an existing client workflow. Start a trial today to see your own GeoGrid data before your next reporting cycle.
Sources
- How to Create a Local SEO Report: Tools & Template included
- Best free Local SEO report templates (2024) - Porter Metrics
- Survey: 82 percent of smartphone shoppers conduct near-me searches