Find Weak Zones with Monthly Heatmap Rank Tracking for Agencies
Published October 7, 2026
Find Weak Zones with Monthly Heatmap Rank Tracking for Agencies

Heatmap rank tracking maps where a Google Business Profile appears for a specific search term across many points in a service area, instead of reporting a single rank from one address. It reveals pockets of strong and weak visibility that a single number hides, and it gives local SEO professionals a geographic view of where work is actually needed. The practical next step is simple: schedule a geo-grid scan and pair the results with Google Business Profile Performance data.
TL;DR:
- Use tighter grids of a few hundred meters in dense urban areas, and scan each exact query separately on mobile and desktop.
- Keep the same five rank buckets across reports and set a fixed color scale; automatic scaling can make unchanged rankings look different.
- Pair grid rankings with monthly Business Profile Performance data and customer actions; impressions show broad demand, while calls, direction requests, and clicks reveal conversion.
- Prioritize weak zones with search activity, then check profile accuracy, reviews, and citation consistency before blaming proximity or changing service areas.
- A single location in a low competition market may get enough insight from a standard rank check and Performance data, without recurring grid scans.
Table of Contents
- What Heatmap Rank Tracking Actually Measures
- How Heatmap Data Is Collected: Grids, Queries, and Controls
- Building Heatmaps That Communicate the Right Signal
- Turning Weak Zones Into a Prioritized Action Plan
- Choosing an Implementation Path: Managed, DIY, or Hybrid
- How Maprank Handles Geo-Grid Scanning
- Combining Heatmaps With Click-Through and Conversion Data
- What Heatmap Tracking Looks Like in Practice
- When Heatmaps Are Worth the Investment
- Try Maprank for Geo-Grid Heatmap Tracking
- FAQ
- Sources
What Heatmap Rank Tracking Actually Measures
A single rank check answers one question: where does a profile sit for one query from one point on the map. That number changes depending on where the search happens, because Google’s local ranking guidance explains that position depends on relevance, distance, and prominence working together. Relevance measures how well a profile matches what someone typed. Distance measures how close the searcher is to the business or service area. Prominence reflects how well known the business is, shaped by reviews, citations, and links.
Because distance is baked into the ranking formula, a business can rank third from one neighborhood and twentieth from another three miles away. A single rank report misses that entirely. Heatmap rank tracking fixes this by running the same query from a grid of coordinates and plotting the results, so the geographic footprint of visibility becomes visible rather than assumed.
This matters more for some business types than others:
- Multi-location brands need to see whether each location’s visibility bleeds into a neighboring location’s territory, creating cannibalization instead of coverage.
- Service-area businesses (plumbers, cleaners, landscapers) rarely have walk-in traffic tied to one address, so a single rank check is almost meaningless; the heatmap shows the real boundary of where they can compete.
- Businesses in dense competitive corridors (urban salons, law firms, dental practices) often see sharp visibility drop-offs within a few blocks, which a point rank check would never catch.
For a single-location business with little nearby competition, a heatmap may simply confirm what a normal rank check already suggested. For anyone with a service radius, multiple locations, or dense local competition, it changes which fixes get prioritized first.
How Heatmap Data Is Collected: Grids, Queries, and Controls
A heatmap is only as reliable as the scan that produced it. The underlying method is a geo-grid scan: the same search query run from a defined set of latitude and longitude points, with the resulting rank recorded at each one.
1. Decide on grid spacing. A loose grid (points a mile or more apart) works for suburban or rural service areas with gradual visibility changes. A tight grid (a few hundred meters apart) is necessary in dense urban cores where rank can shift within a few blocks, especially for categories like salons, restaurants, or medical offices where competitor density is high.
2. Lock in the query set. Use the exact phrases customers search, not internal shorthand. Running “hair salon near me” and “best hair salon” as separate scans produces different maps, and conflating them later makes trend analysis unreliable.
3. Record metadata at every point, every time. Each scan point should capture the query text, coordinates, device type, timestamp, language setting, and whether the profile returned a result at all (“not found” is a data point, not a gap to ignore).
4. Choose a collection method deliberately. A managed dashboard with scheduled scans removes manual work but limits raw data access. A direct API integration gives full control over grid design and storage but requires engineering time and attention to usage terms. Manual scraping is the least reliable option and carries the most compliance risk; it tends to break without warning and should be avoided for client-facing reporting.
5. Reconcile scan data with aggregate data. Google’s Business Profile Performance API returns monthly keyword impression aggregates, and those figures can be thresholded rather than exact. That data answers a different question than a geo-grid scan: it shows overall search volume and visibility trends, not the geographic shape of rankings on a specific date. Keep both datasets, and document how they relate instead of treating one as a substitute for the other.
Pro Tip: Run scans on a fixed day each month (the first Tuesday, for example) so comparisons across periods aren’t skewed by mid-month ranking volatility.
Device matters more than most people assume. Mobile and desktop results can differ for the same query from the same coordinates, because of how Google weighs location signals differently across device types. A heatmap built only from desktop scans will not match what most searchers actually see, since the majority of local searches now happen on mobile.

Building Heatmaps That Communicate the Right Signal
A heatmap can be accurate in its underlying data and still mislead a reader, usually because of a rendering choice rather than a data problem. The fix starts with fixed rank buckets instead of a continuous color scale.
A useful bucket structure looks like this:
- Top 3: the profile appears in the most visible positions for that query and point.
- 4 to 10: visible but requiring more scrolling or map interaction to find.
- 11 to 20: unlikely to be seen without a deliberate search.
- 21 to 50: effectively invisible for that query at that point.
- Not found: the profile did not return in the scanned result set at all.
Keeping these same five buckets across every report, every month, every client, is what makes a heatmap trustworthy over time. The moment buckets shift between reports, color comparisons become meaningless.
The Maps JavaScript API’s HeatmapLayer documentation lists the controls that shape how a heatmap renders: radius, gradient, maxIntensity, dissipating, and opacity. The one that causes the most reporting errors is maxIntensity. Left on automatic, the layer rescales its color gradient to the current dataset’s maximum value every time it renders, which means a map showing identical rankings in two different months can look completely different simply because the color scale recalculated. Setting a fixed maxIntensity value, tied to the bucket structure rather than the data itself, keeps the same rank always producing the same color.
Weighted points versus presence counts is the next decision. A presence count simply marks whether the profile appeared at a given point. A weighted point multiplies that presence by another value, like impressions or clicks, to emphasize zones that matter more commercially. Weighting is useful when a client wants to see where ranking well would translate to the most business impact, not just where ranking is technically strongest.
One rendering choice protects against misleading color shifts: a fixed legend tied to fixed bucket definitions, documented with the scan’s date, query, and device assumptions on every report. This single habit separates a heatmap that communicates something real from one that just looks impressive.
Every exported map should carry the same footer information: scan date and time, exact query text, device type, and the bucket legend used. Without that context, a heatmap is a pretty picture with no diagnostic value. With it, a client or team member six months later can reconstruct exactly what was measured and compare it fairly.
Turning Weak Zones Into a Prioritized Action Plan
A heatmap’s value isn’t the map itself. It’s what the weak cells tell a team to go check.
1. Verify profile accuracy first. Confirm the business category, service-area radius, address data, and attributes are complete and correctly set for the affected zone. Google’s own local ranking guidance treats complete, accurate profile information as a direct input into relevance, so this is the cheapest fix with the fastest potential payoff.
2. Cross-reference with Performance data. Before investing time in a weak zone, check Google Business Profile Performance and Insights for that area’s search volume. A weak cell in a zone with almost no search activity is a lower priority than a weak cell in a zone generating steady views and actions.
3. Audit reputation signals. Review count, review recency, and review response rate all feed into prominence. A weak zone with a thin review profile relative to nearby competitors points to a reputation gap, not a technical one.
4. Check citation consistency. Inconsistent business name, address, or phone data across directories undermines prominence and can quietly suppress rankings in specific zones without any obvious profile error. Our citation consistency analyzer is one way to spot mismatches before they compound.
5. Assess proximity and operational limits last. Sometimes a weak zone simply reflects geographic reality: a competitor physically closer to that cluster of searchers. This is the hardest issue to fix and shouldn’t be the first thing the team chases.
Pro Tip: Build a short checklist per weak zone: profile fields checked, review velocity compared to nearby competitors, citations audited, and performance data cross-referenced. Running the same five steps for every weak cell keeps diagnosis consistent across a whole service area.
For a deeper walkthrough of fixes that tend to move the needle fastest, our guide on quick fixes for low local rankings covers the most common culprits in more detail.
Choosing an Implementation Path: Managed, DIY, or Hybrid
Three realistic paths exist for building heatmap rank tracking into a workflow, and the right one depends on budget, technical capacity, and how many locations need tracking.
Managed SaaS platforms run scheduled geo-grid scans on a fixed cadence and generate the visualization automatically. This removes the engineering burden entirely but trades some raw data access for convenience. For agencies managing dozens of client locations, this is usually the only sustainable option.
API-driven custom builds give full control over grid design, bucket definitions, and rendering choices using libraries like the Maps JavaScript API, deck.gl, or Mapbox. This path suits teams with engineering resources who want to control every visualization detail, but it requires ongoing maintenance as APIs change.
Spreadsheet and static export approaches work for small, infrequent audits. A manual grid of twenty points, checked quarterly and plotted with a basic color scale in a spreadsheet tool, is better than no visibility data at all, even if it lacks automation.
Whichever path gets chosen, a few things apply across all of them:
- Retain raw scan records, not just the rendered image. Raw point data is what makes month-over-month trend analysis possible; a saved map image alone cannot be re-bucketed or re-analyzed later.
- Match export formats to reporting needs. CSV or JSON exports that include coordinates, rank, and timestamp per point make it far easier to cross-reference with Performance data later.
- Set a consistent reporting cadence. Monthly scans aligned with Performance data’s own monthly update cycle keep both datasets comparable.
- Document the reconciliation method between point-in-time grid scans and the aggregated monthly impression data from Google’s Performance API, since the two measure different things and will rarely match exactly.
For teams that want a broader view of how heatmap data fits into overall performance tracking, this SEO performance tracking guide walks through aligning multiple metrics into one reporting workflow.
How Maprank Handles Geo-Grid Scanning
Our Maprank geo-grid rank tracker runs scheduled scans across a defined grid of points in a business’s service area, preserving the coordinates, query text, device type, and timestamp for every single point rather than collapsing everything into one rank number. That raw metadata is what makes month-over-month comparison possible instead of guesswork.
Maprank pairs that grid data with Business Profile signals, surfacing specific recommendations tied to what a weak zone actually needs: a profile field to correct, a review gap to close, or a citation inconsistency to fix. The goal is a map that points directly at the next task rather than one that just looks interesting.
As part of Local SEO Bot’s broader platform, Maprank connects to:
- Automated Google Business Profile optimization and posting, so profile accuracy issues surfaced by a weak zone get corrected without manual follow-up.
- Manually built premium citations on high-authority directories, handled by a dedicated team rather than automated submission tools.
- Automated review generation and AI-assisted review replies, addressing the reputation side of prominence.
- A 30-day money-back guarantee if a business doesn’t see a ranking increase, which we offer as a sign of confidence in the approach.
For readers evaluating a turnkey option against a DIY build, the Maprank Google Maps rank tracker product page details the specific grid scan and reporting features.
Combining Heatmaps With Click-Through and Conversion Data
A heatmap shows where a profile ranks. It doesn’t show whether that ranking produces a phone call. Pairing grid-scan data with Business Profile Performance’s action metrics, calls, direction requests, and website clicks, answers the question a rank map alone cannot: does visibility in this zone actually convert?
A zone that shows strong top-three rankings but generates few actions relative to its search volume suggests a profile or listing presentation problem, not a ranking problem. Conversely, a moderately ranked zone with high action rates relative to its views suggests strong intent worth protecting with faster response times or more proactive review requests.
The most useful version of this analysis overlays three layers: rank position by zone, search volume by zone, and action rate by zone. Zones that are strong on all three are worth defending. Zones strong on rank but weak on actions are worth a listing or photo audit. Zones weak on rank but showing disproportionate action rates, often from a small number of highly motivated searchers, deserve priority ranking work because the commercial upside per point gained is higher there than elsewhere.

This layered view turns a heatmap from a descriptive tool into a prioritization tool, which matters more for agencies juggling limited hours across many client locations than for a single owner-operator checking their own visibility occasionally.
What Heatmap Tracking Looks Like in Practice
A multi-location service business often discovers through a first grid scan that one location’s territory overlaps heavily with a neighboring location’s, with both competing for the same searchers instead of covering distinct ground. The fix isn’t more content or more citations. It’s adjusting service-area settings so each profile targets a distinct zone, which a single rank check would never have revealed because it only looks at one point per location.
A single-location service-area business (a mobile detailing company, for example) might find through heatmap scanning that visibility drops sharply beyond a four-mile radius, even though the business accepts jobs up to twelve miles out. That gap between actual service radius and visible ranking radius is a direct signal to tighten the service-area setting in the profile or invest in citations that reinforce relevance for the underperforming zones.
A dense-market salon or clinic might see strong rankings on weekdays and a measurable dip on weekends, traceable to review response timing, a pattern that would stay invisible without recurring scans at consistent intervals. In each case, the map didn’t solve anything by itself. It pointed to a specific, checkable cause, which is the entire value of treating heatmaps as a diagnostic tool rather than a vanity report.
When Heatmaps Are Worth the Investment
Heatmap rank tracking earns its keep for multi-location brands, service-area businesses, and anyone competing in a dense local vertical where rank can shift within a few blocks. For a single-location business in a low-competition market, a simpler rank check and a glance at Performance data usually tell the same story with less setup.
The real risk isn’t skipping heatmaps. It’s treating the colors as proof of anything without checking them against actual search volume and customer actions. A map is a hypothesis generator, not a verdict.
— Devyn H
Try Maprank for Geo-Grid Heatmap Tracking
Tracking one rank number per location leaves most of a service area unmeasured, and manually stitching together grid scans, profile data, and action metrics takes hours most owners and agencies don’t have.
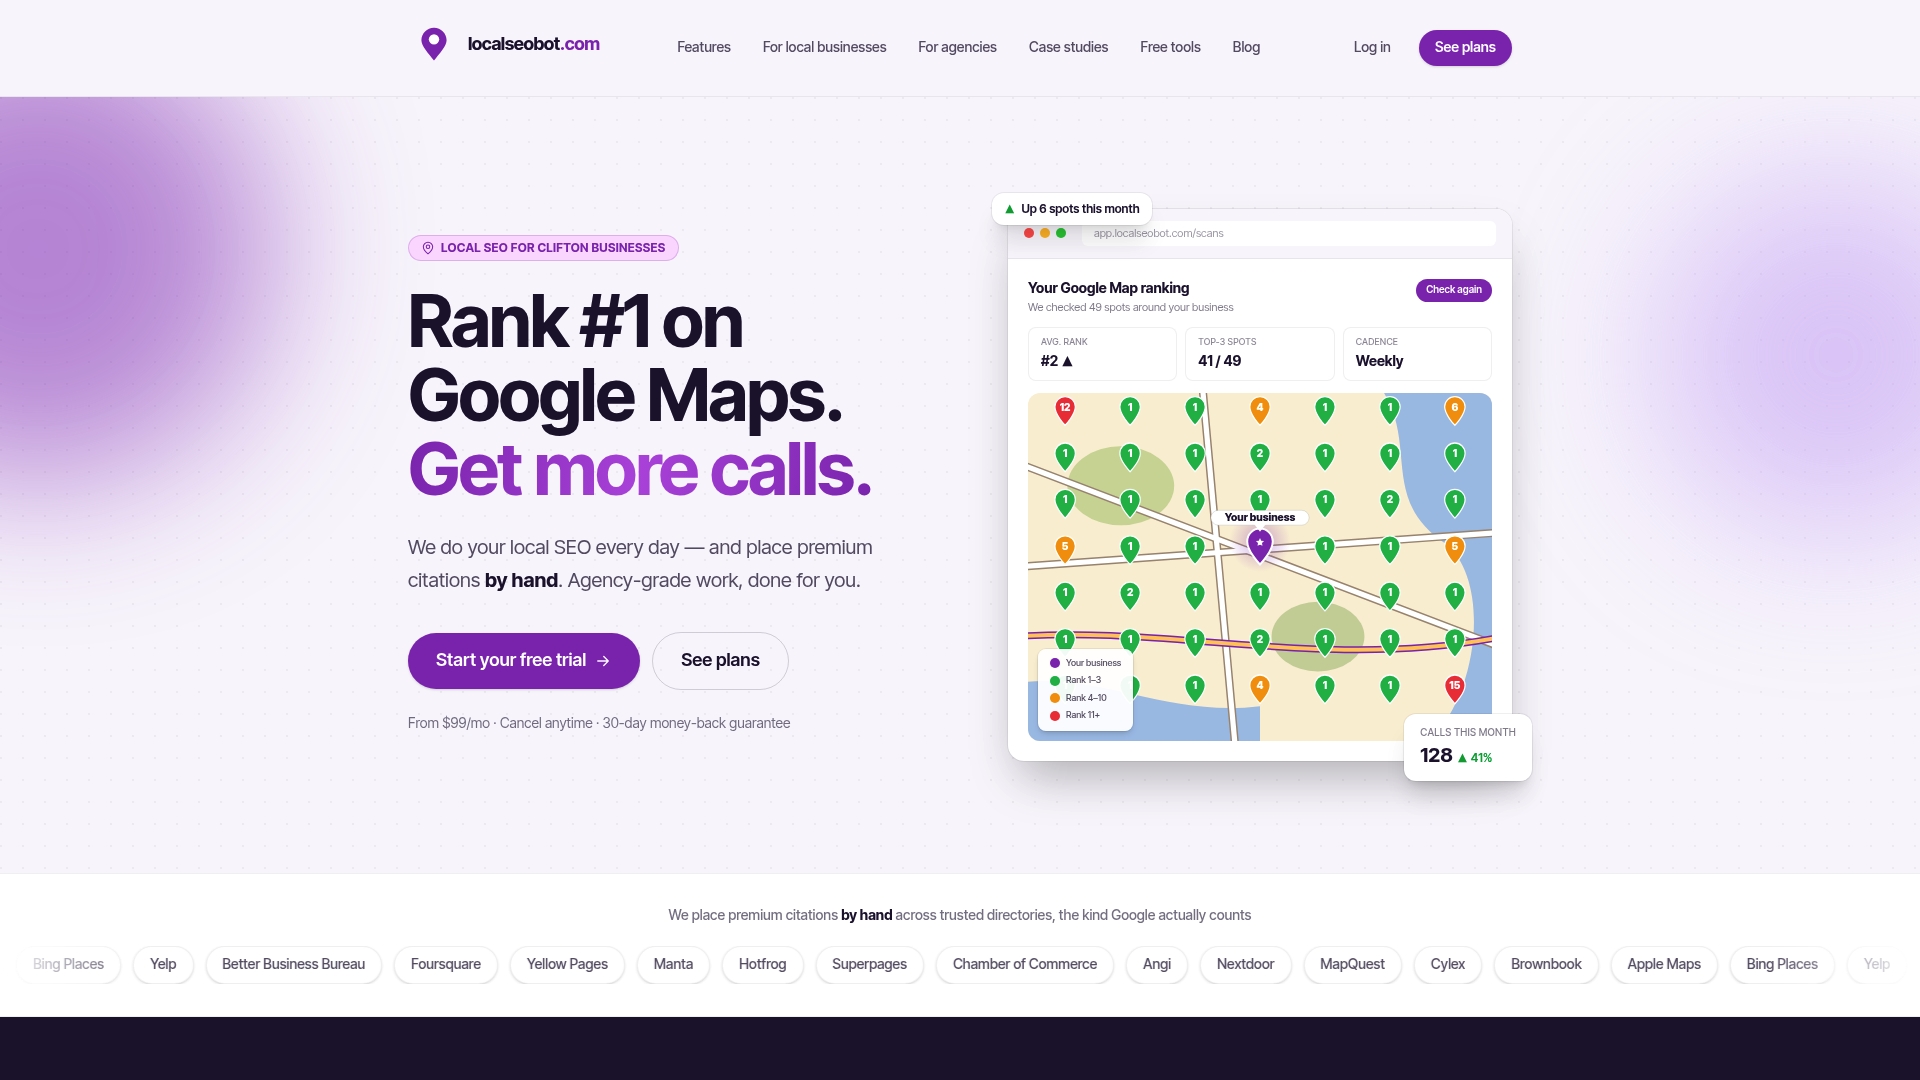
Our Maprank geo-grid rank tracker runs the scans, preserves the metadata, and ties weak zones to specific fixes automatically, backed by a 30-day money-back guarantee if rankings don’t improve, a claim we stand behind as part of our approach.
- Check current plans on our pricing page for up-to-date pricing information.
- Agencies managing multiple client locations can review white-label options on the agency pricing page for details on available plans.
- Start with a scan of your own service area to see where your visibility actually stands before deciding on a plan.
FAQ
What is heatmap rank tracking?
Heatmap rank tracking runs the same search query from a grid of coordinates across a service area and plots the resulting rank at each point on a map. It shows the geographic shape of visibility instead of a single rank number from one address.
How to rank in Google Maps?
Google’s own guidance ties Maps ranking to relevance, distance, and prominence, so improving rank means strengthening how well a profile matches search terms, keeping business information accurate, and building reviews, citations, and links that establish prominence. Heatmap scans help confirm which zones are already strong and which need that work most.
Does Google Analytics have a heatmap feature?
Google Analytics does not include a built-in geographic heatmap for local search rankings; that kind of map requires a dedicated geo-grid scanning method and a visualization layer like the Maps JavaScript API’s HeatmapLayer. Business Profile Performance is the relevant Google source for views, searches, and action metrics tied to a profile.
What is rank tracking and how does it work?
Rank tracking records where a business or webpage appears in search results for specific queries over time, typically by running automated searches and logging the position returned. For local businesses, geo-grid rank tracking extends this by running the same query from multiple geographic points rather than just one, producing a map instead of a single number.
How can I view my heatmap on Strava?
Strava’s heatmap feature shows aggregated activity data from athletes and has no connection to local search rank tracking or Google Maps visibility; it lives entirely within Strava’s own app and account settings. For Google Maps ranking visibility, a geo-grid rank tracking tool is the relevant method rather than any fitness app feature.
Sources
- Tips to improve your local ranking on Google - Google Business Profile Help
- Heatmap Layer | Maps JavaScript API | Google for Developers
- Method: locations.searchkeywords.impressions.monthly.list | Google Business Profile APIs | Google for Developers